If you're anything like me, you probably think that "talking about the weather" is usually a sign that someone doesn't know how to talk to you, and is trying to find some "safe" ground to build from. Unless you're talking to a meteorologist, gardener, farmer, pilot, permaculture enthusiast, reptile keeper, even some builders, engineers, and painters can all be significantly impacted by the weather.. and can be a topic of great importance and consequently, a sensitive subject like religion and politics to some.
I've been meaning to build a weather station for... years now. There are some fantastic Raspberry Pi based Projects out there on the web. If you don't know what a Raspberry Pi is, or prefer to look at the alternatives like the various models of Arduino, please see my article:
The particular project that got me started, can be found here:
https://projects.raspberrypi.org/en/projects/build-your-own-weather-station
I really liked the clarity of the instructions, the necessary components, and the tips littered throughout the build. If you are considering it, I'd strongly suggest that you read it thoroughly before you start buying parts, let alone build the station.
So I bought a standard weather station sensor kit (available from here) shortly after discovering the project back in 2018. But the project would make little progress beyond breadboard prototyping in the rare moments I'd get time to do some work on it, then it would sit around for months as other projects stole me away to do other things. I didn't get to soldering my electronics until October 2019, and finally between January-August 2020, I've been coding up the various bits. Yes I know it has been a low priority.
Of course, in the mean time, I've started new jobs, built my own 3D printer (from a kit), learned to use aforementioned printer, dealt with family emergencies, built kitchen cabinetry, completely re-built large sections of my workshop, garden, photography setup.... the list goes on....
Prepping the Pi System
Before we begin coding, you need the environment to both run and test the Python scripts shown below. Now if you're a complete beginner, or even a veteran Pi user, I find it handy to at least list a general overview of the process to get the system ready. Frankly, I don't remember everything I configured two months ago, let alone years.
To that end...
#### BASIC RASPBIAN SETUP #####

#Once you've copied a Raspbian system to your SD card, boot your Pi up and run the command:

raspi-config

#(To configure Wi-Fi and other fun things… like changing from the default password, and enable SSH if you don’t have a desktop installed).

#While in raspi-config, I’d also recommend enabling both I2C and SPI under the interfaces menu, we'll use that later. Once you're happy, save and exit raspi-config.


#### Before installing anything: ####

#(To ensure you have everything up to date, run this command.. with an administrative-capable account)

sudo apt-get update && apt-get upgrade

#(this upgrades everything that’s already installed to the latest version).


############ Getting Python sorted: ###########

sudo apt-get install python3-pip

#### Installing MariaDB (MySQL) ###

sudo apt-get install -y mariadb-server mariadb-client libmariadbclient-dev

sudo pip3 install mysqlclient

### CONFIGURING A MYSQL (or MariaDB) DATABASE ###

sudo mysql (enters the MySQL interface)

### CREATING A MYSQL USER ###

create user pi IDENTIFIED by ‘password’;

#(change the username pi and/or password to something you’ll remember/more approrpiate)

### GRANTING MYSQL USER PRIVILEGES ###

grant all privileges on *.* to pi with grant option;

#(Ok you just gave complete control of all databases to your user, you can be limit it to a specific database if you wish, but then you'll have to come back to this step once your database is made)

### MAKE MY DATABASE ####

#NOTE: each line can be entered verbatim (if you like the name of the database, table and every column in the table... or change it to your preferences. (Just note them down for later use).

create database weather;

use weather;

#Creating a table inside database “weather” (copy and paste of the entire block ending in the semi-colon could well be your next best friend... or change it to taste.)

CREATE TABLE WEATHER_MEASUREMENT(
ID BIGINT NOT NULL AUTO_INCREMENT,
LOCATION_ID BIGINT,
AMBIENT_TEMP DECIMAL(6,2) NOT NULL,
GROUND_TEMPERATURE DECIMAL(6,2) NOT NULL,
AIR_PRESSURE DECIMAL(6,2) NOT NULL,
HUMIDITY DECIMAL(6,2) NOT NULL,
WIND_DIRECTION DECIMAL(6,2) NULL,
WIND_SPEED DECIMAL(6,2) NOT NULL,
WIND_GUST_SPEED DECIMAL(6,2) NOT NULL,
RAINFALL DECIMAL (6,2) NOT NULL,
CREATED TIMESTAMP NOT NULL DEFAULT CURRENT_TIMESTAMP,
PRIMARY KEY ( ID )
);

##### EXIT MySQL/MariaDB ######

quit

#(Back to your normal command prompt now).


#Now we need to work on some more python libraries for our code to work:

sudo pip3 install gpiozero smbus smbus2 mysql-connector mysql spidev

# Using BME280 sensor? install the library for that by typing:

sudo pip3 install RPi.bme280

# Using BME680 sensor? install the appropriate library by entering:

pip3 install adafruit-circuitpython-bme680

####### NOW WOULD BE A GOOD TIME TO READ THE WEATHER STATION PROJECT PAGE LINKED WAY ABOVE, CONNECT EVERYTHING, AND PREP FOR CODING/DEBUGGING ##########
Coding the Python Scripts...
Initially, I coded it from scratch in Python 2.7, but the power was cut to my aging Pi and the SD card was completely corrupted. Since I was still working on it, I hadn't actually backed it up at that point. I got frustrated, and went off to do other things... months went by and I came back. Unfortunately, I could only remember the general gist of my old code, so I decided to redo it from scratch. I upgraded the Pi to a 3B+ model. To save time, I based my code (up to a point) off the code hints in the instructions, but decided to upgrade my Python version to 3.8.5 (the latest at the time of writing).
Branching out on my own...
Ok, so there are a few things that you should know about the instructions that I wish I knew back when I was building this the first time.
- The code from the examples works... but can have problems if you're running older versions of Python and certain combinations of the multitudes of Python plugins that you can install with the pip command.
- The code needs some interesting adjustments when you use different hardware to the specified components. I chose to use a BME680 sensor instead of a BME280.This had a few additional considerations:
- When I wrote my own code, I actually used the SPI wiring configuration to talk to the BME680 sensor. However, when I used the example code, I switched it to I2C. This required some not-very-creative rewiring.
- When using different connections, please note that different libraries are also needed to be installed into your code (SPI versus I2C).
- Also, some of the commands for the new sensor were somewhat different from the suggested code.
- Even using the same hardware, wiring choices can make a significant impact. Perhaps my greatest problem was using a 3.3V power source for my wind vane connection instead of the suggested 5V power supply. This greatly changed the expected values and I needed to write my own Python script to not only assign varying voltages to specific bearings, but to manage the inevitable confusion found in using a lower voltage due to rounding errors. Of course, there are ways to code around this, but that goes a little beyond the instructions used here.
- The instructions pertaining to MariaDB (a variety of MySQL database) are somewhat dated. You see, I'm from the era where MySQL was an incredibly popular database choice. However, databases like these, once they've stored thousands of weather records over time, can overwhelm the computational power of a Raspberry Pi. A better choice is to use a time-series database like InfluxDB which is lighter on processing, cuts any excess characters where possible, and has the ability to incorporate data retention policies that can delete/reduce stored data as it ages into obscurity/little practical use. Or to put it another way, do you really need every 5 minutely record (that's 288 records per day) of weather 3 years ago? Or would it be better to simply store the minimum, average, maximum temperatures and total rainfall for each day?
A copy of my (mostly working) code:
I have included not one, but two variations of my Python code that are closely adapted from the instruction code for your ease of use. Both assume a few things:
- You're using the same weather sensor array (vane, rain bucket, and anemometer) as I have, which is the same as the one mentioned in the instructions. (Note I'm not using the BME280 sensor, but the BME680, and my supplied voltage to the weather vane is only 3.3V instead of the recommended 5V. The different voltage to the vane won't actually affect the code here, but will in the voltage divider/wind direction files the instructions talk about.
- That you've wired everything as the instructions indicate (excluding my 3.3V variation, also, I chose not to use a soil temperature probe... mostly because they tend to corrode pretty quickly and it's just another cable I have to run from inside to the garden).
- You've installed Python 3.5 or higher, along with the requisite modules for the hardware. Most of those are mentioned in the instructions.
The first version puts the recorded sensor data into a MariaDB (MySQL) style database. The second copy puts recorded data into an InfluxDB database. All bits highlighted in green may need to be adjusted for the sensor you use, the database name, database table/measurement name (depending on the database used) as well as the database username and password.
Remember: You need to create the database, table (not needed with Influx), database user account, password, and grant privileges before you can connect your Python program and start entering your data. Also, please create your own version of the voltage_divider and wind_direction_byo Python scripts as indicated in the project instructions. (These weather station programs below won't run alone).
MariaDB version of WeatherBYO.py code (largely as it is written in the instructions)
MARIADB/MYSQL weatherBYO.py


from gpiozero import Button
import math
import time
import datetime
import statistics
import bme680_sensor
import wind_direction_byo
import os
import mysql.connector
from mysql.connector import Error


store_speeds = []
store_directions = []

altitude_pressure_offset = 75  # number of hectopascals your readings are too low for a given altitude.

# Sea level should be 1000 hPa on average.
# To calculate offset, 120 hPa/mbar per kilometer of altitude.
# Mine was 627m above sea level, so my offset was (627/1000)*120 = 75.24 hPa. (This is a rough guideline, but should be within a few hPa/mbar)
# Adjust to fine tune with other local weather stations.
# Simply add this to your raw sensor readings.


rain_count = 0 # counts the number of "tips" the bucket has done.
wind_count = 0 # counts how many half rotations
radius_cm = 9.0 # radius of the anemometer
wind_interval = 5 # how often the speed is reported (in seconds)
cm_in_a_km = 100000.0
secs_in_an_hour = 3600
adjustment = 1.18 # Multiplier to compensate for energy lost pushing the anemometer
interval = 300 # This runs the While true loop every 5 mins
bucket_size = 0.2794 # The measured rainfall in mm for every tip of the bucket


# Every half rotation, add 1 to the count)

def spin():
    global wind_count
    wind_count = wind_count + 1
#    print ("spin" + str(wind_count))


# Calculate the wind speed:

def calculate_speed(time_sec):
    global wind_count
    circumference_cm = (2 * math.pi) * radius_cm
    rotations = wind_count / 2.0

    # Calculation distance traveled by a cup in cm
    dist_km = (circumference_cm * rotations) / cm_in_a_km

    km_per_sec = dist_km / time_sec

    km_per_hour = km_per_sec * secs_in_an_hour

    return km_per_hour * adjustment

wind_speed_sensor = Button(5)
wind_speed_sensor.when_pressed = spin

def reset_wind():
    global wind_count
    wind_count = 0

def bucket_tipped():
    global rain_count
    rain_count = rain_count + 1

def reset_rainfall():
    global rain_count
    rain_count = 0

rain_sensor = Button(6)
rain_sensor.when_pressed = bucket_tipped

##### DATABASE PREP ######

while True:
    weather_db = mysql.connector.connect(host='localhost', database='weather', user='DATABASEUSER', password='NOTREALPASSWORD')

# Loop to measure wind speed and report at 5 second intervals
    start_time = time.time()
    while time.time() - start_time <= interval:
        wind_start_time = time.time()
        reset_wind()
        #time.sleep(wind_interval)
        while time.time() - wind_start_time <= wind_interval:
            store_directions.append(wind_direction_byo.get_value())

        final_speed = calculate_speed(wind_interval)
        store_speeds.append(final_speed)

    wind_dir = wind_direction_byo.get_average(store_directions)
    wind_gust = max(store_speeds)
    wind_speed = statistics.mean(store_speeds)
    rainfall = rain_count * bucket_size
    ambient_temp = bme680_sensor.read_temp()
    pressure = bme680_sensor.read_pressure() + altitude_pressure_offset
    humidity = bme680_sensor.read_humidity()

    now = datetime.datetime.now().replace(microsecond=0)

    mycursor = weather_db.cursor()
    sql = """INSERT INTO table_name (AMBIENT_TEMP, AIR_PRESSURE, HUMIDITY, WIND_DIRECTION, WIND_SPEED, WIND_GUST_SPEED, RAINFALL) VALUES (%s, %s, %s, %s, %s, %s, %s)"""
    recordTuple = (ambient_temp, pressure, humidity, wind_dir, wind_speed, wind_gust, rainfall)
    mycursor.execute(sql, recordTuple)
    weather_db.commit()
#    print("This entry was successfully inserted into the database.")
    store_speeds = []
    store_directions = []
    reset_rainfall()
InfluxDB version of the WeatherBYO.py code (again, largely as written in the instructions)
from gpiozero import Button
import math
import time
import datetime
import statistics
import bme680_sensor
import wind_direction_influx #This is the wind_direction python script you need to create. I have named it influx for this particular script.
import os
from influxdb import InfluxDBClient


location = 1 # Outside weather station
measurement_name = 'sensor_data' #This is effectively the table name for Influx styled databases.
store_speeds = []
store_directions = []


altitude_pressure_offset = 75  # number of hectopascals your readings are too low for a given altitude.

# Sea level should be 1000 hPa on average.
# To calculate offset for your altitude the rate of pressure drop is, 120 hPa/mbar per kilometer of altitude.
# Mine was 627m above sea level, so my offset was (627/1000)*120 = 75.24 hPa. (This is a rough guideline, but should be within a few hPa/mbar)
# Adjust to fine tune with other local weather stations. Simply add this to your raw sensor readings.


rain_count = 0 # counts the number of "tips" the bucket has done.
wind_count = 0 # counts how many half rotations
radius_cm = 9.0 # radius of the anemometer
wind_interval = 5 # how often the speed is reported (in seconds)
cm_in_a_km = 100000.0
secs_in_an_hour = 3600
adjustment = 1.18 # Multiplier to compensate for energy lost pushing the anemometer
interval = 300 # This runs the While true loop every 5 mins
bucket_size = 0.2794


weather_db = InfluxDBClient(host='localhost', port=8086, database='INSERT_DATABASE_NAME_HERE', username='INSERT_DATABASE_USERNAME_HERE', password='INSERT_DATABASE_PASSWORD_HERE')


# Every half rotation, add 1 to the count)

def spin():
    global wind_count
    wind_count = wind_count + 1
#    print ("spin" + str(wind_count))


# Calculate the wind speed:

def calculate_speed(time_sec):
    global wind_count
    circumference_cm = (2 * math.pi) * radius_cm
    rotations = wind_count / 2.0

    # Calculation distance traveled by a cup in cm
    dist_km = (circumference_cm * rotations) / cm_in_a_km

    km_per_sec = dist_km / time_sec

    km_per_hour = km_per_sec * secs_in_an_hour

    return km_per_hour * adjustment

wind_speed_sensor = Button(5)
wind_speed_sensor.when_pressed = spin

def reset_wind():
    global wind_count
    wind_count = 0

def bucket_tipped():
    global rain_count
    rain_count = rain_count + 1

def reset_rainfall():
    global rain_count
    rain_count = 0

rain_sensor = Button(6)
rain_sensor.when_pressed = bucket_tipped

 ##### THE LOOP OF DOOM... or just weather data hunting/gathering ####

while True:

# Loop to measure wind speed and report at 5 minute intervals
    start_time = time.time()
    while time.time() - start_time <= interval:
        wind_start_time = time.time()
        reset_wind()
        #time.sleep(wind_interval)
        while time.time() - wind_start_time <= wind_interval:
            store_directions.append(wind_direction_influx.get_value())

        final_speed = calculate_speed(wind_interval)
        store_speeds.append(final_speed)

    wind_dir = wind_direction_influx.get_average(store_directions)
    wind_gust = max(store_speeds)
    wind_speed = statistics.mean(store_speeds)
    rainfall = rain_count * bucket_size
    temp = bme680_sensor.read_temp()
    pressure = bme680_sensor.read_pressure() + altitude_pressure_offset
    humidity = bme680_sensor.read_humidity()


    data = [
    {
        "measurement": measurement_name,
            "tags": {
                "location": location,
            },
            "time": time.ctime(),
            "fields": {
                "temperature": temp,
                "rainfall": rainfall,
                "humidity": humidity,
                "pressure": pressure,
                "wind_speed": wind_speed,
                "wind_gust": wind_gust,
                "wind_direction": wind_dir
                }
        }
    ]
    weather_db.write_points(data)
    store_speeds = []
    store_directions = []
    reset_rainfall()
Once your data is in a database, getting it out without typing SQL queries every time seems important...
The weather station project instructions suggest some ways you might consider displaying the data in a user-friendly way, but doesn't go into detail for that. Some of the suggestions mentioned include:
- Elastic Stack/Kibana... this is a "big data" package that is popular in fortune 500 companies. However, only very old versions of the software are included in the Raspbian repositories. Also, this is far from the most efficient option out there.
- Node Red: This is a really interesting tool. Some instructions encourage users to forgo writing a simple Python program and use Node Red to drive recording and displaying of weather data. However, this is far from the easiest system to use, and there are some quirks in here. I used the basic Python code to write data to the database, and then simply used node-red driven database queries to present the data in an attractive web-based dashboard.
- Grafana: This is, simply put, a nice easy way to show graphs and gauges of data. However, while this is a very popular choice for projects like these, there are quirks which are difficult to understand, let alone fix, but if you like a very customizable experience, then it's hard to beat Grafana. However, some plugins such as the "wind rose" are far from intuitive to use, and can crash the system.
I originally looked into the Elastic stack, but it was somewhat problematic for an old Raspberry Pi. So I started using Node Red:
Using Node Red:
Node Red goes way beyond merely making pretty graphs. It reminds me of industrial microcontroller programming suites. Insert a "Node" that performs a certain function, then link it to another "Node" which takes the output of the first node, does whatever it needs to do, and spits out an output which may in turn be used by other nodes or just show/store the data somehow, or instigate some sort of electronic response.
I'm not going to describe installing Node Red, there are plenty of sites that tell you how to do that. (Not least of all on the Node Red site). Once you've got it installed and running, you can simply use a web browser to go into the configuration interface. (If you're using your Pi directly, it'll be "localhost:1880"), or if you're doing it remotely, it'll be the <IP address of your Pi>:1880. So if your Pi is running with the IP address 192.168.1.100, the interface will be at the following URL:
http://192.168.1.100:1880
Welcome to the Node Red Interface....
Chances are, you'll need to add a few extra "palettes" to include the charts and gauges you'll need, and the "dash board" which may not be there by default. Again, there are pages and YouTube videos telling you how to do that.
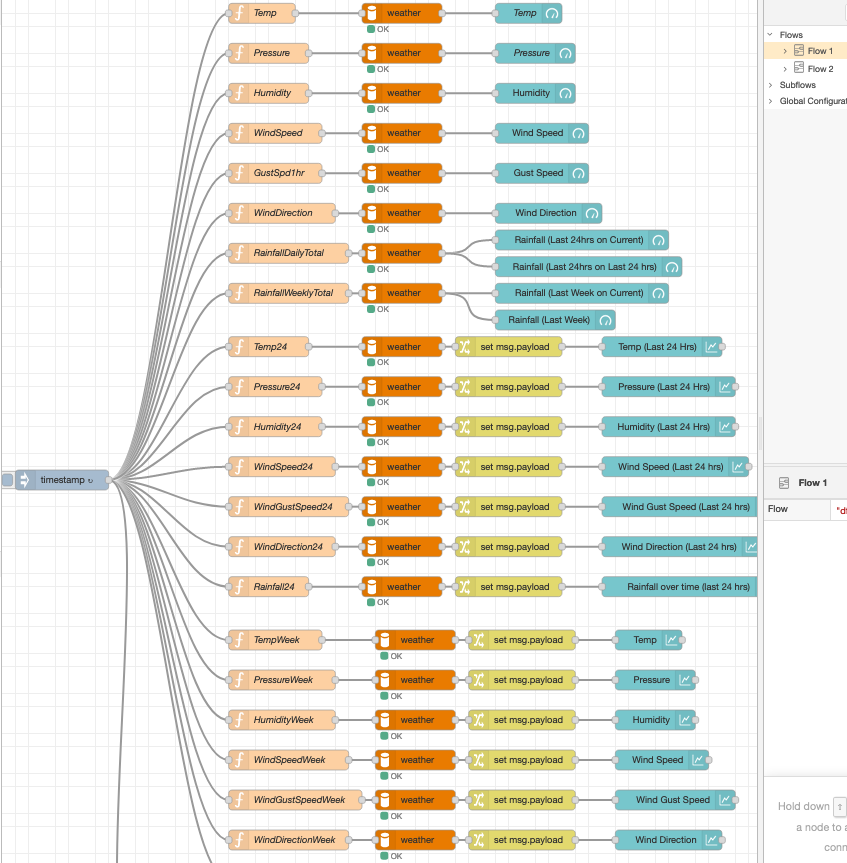
Note that the left-most node is a timestamp. You can configure it to trigger the flows at regular intervals, or click the square button on the left of the timestamp node to trigger the flows manually. Without a time stamp, you won't run any flows.
Node Red is extremely powerful. However, when it comes to creating charts, it is very specific when it comes to data formatting the data for those charts. I haven't found a nice way to create multiple charts with a single command, or adjust them to show different time periods like:
- Last hour,
- Last day,
- Last week,
- Last month,
- Last year.... or beyond.
So many beginners will likely have a flow like mine, multiple SQL queries (the pale orange nodes), with current readings, 24 hour and weekly histories for each variable (temperature, humidity, rainfall, etc). Naturally every query is linked to the same database (orange node), then formatted using Javascript Object Notation (JSON) in yellow "Change" nodes, then graphed in the respective blue chart.
I'm an absolute beginner when it comes to Javascript and JSON. This challenged me for quite some time while I was trying to find a working example for the charts.
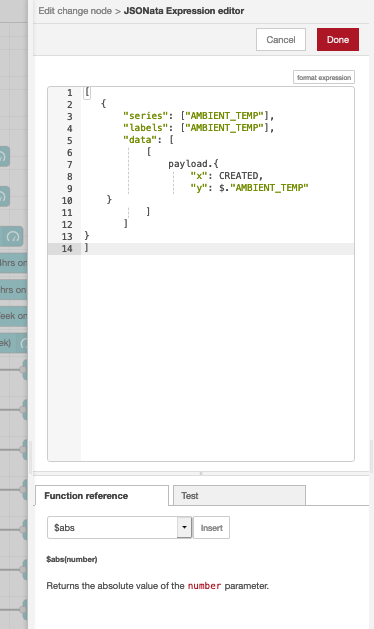
For those not familiar with JSON, the yellow Change node has the following JSON code. Note that CREATED and AMBIENT_TEMP are two column names in my MySQL database, you'll need to adjust them whatever you've called the columns in your database table:
Node Red Gauges are also a little hard to follow without an example. Unlike charts, they do not need a yellow "Change" node like the charts mentioned immediately above, but instead need you to configure the Gauge node directly. Note the "Value format" field. Again, I'm using the AMBIENT_TEMP column from my database.

Yes, that's:
{{msg.payload[0].AMBIENT_TEMP}}
In short, from the database, there will be a "message payload 0" (the first and only payload of data coming out, which starts with the counter 0). Show the value in the column, "AMBIENT_TEMP". Obviously, you need to rename it that for whatever column name is coming out of your SQL query.
Remember: A gauge can show ONLY 1 value, so if you want the latest reading, you need to sort your SQL query in descending order by time, and then limit it to 1 record in your SQL query. That gets done further "up stream" in my pale orange function.
Here is an example of my SQL query in the function node, which returns the most recent record (hopefully current reading if the Python script hasn't crashed, fallen over, ended up in a well):
msg.topic = "SELECT AMBIENT_TEMP FROM WEATHER_MEASUREMENT ORDER BY CREATED DESC LIMIT 1;"
return msg;
Note that "WEATHER_MEASUREMENT" is the name of my MySQL database table. If you have a different name, you'll need to adjust the query accordingly. The ORDER BY CREATED DESC arranges all records in descending chronological order (newest first) based on the column "CREATED" which stores the date and time each record was added to the database. LIMIT 1 just tells to return the single newest record for the gauge.
When you configure the charts, you'll need to assign each chart to an appropriate dashboard, and group so you put them in the right place.


Problems with Node Red:
I've already suggested that it's quite cumbersome to use as far as adjusting records based on varying time periods/scales. In fact, there really isn't a nice way that I've found to do that. Also, for the weekly and even worse, monthly and beyond scales, the thousands of data points take nearly 10 seconds to load at the weekly level, most of a minute for monthly, and the yearly. (test data).. crashed my Pi. So there are definite down sides with MariaDB and Node Red. I'm sure it can be made more efficient, but I haven't bothered so far.
Also, lets say that you want to plot three lines (min, mean, and max temperature) for each day on a single graph. This is possible using Node Red, but it is anything but trivial to do. I haven't found a nice way to do this, so I actually started looking to other options to overcome this limitation.
I've also had problems with MySQL connections dropping occasionally, sometimes my Python program runs perfectly for days, then arbitrarily collapses. So I come back to find that no records have been added since that collapse. I haven't found any good reasons from the logs to suggest what the problem is. I suspect there may be some hardware issues like thermal regulation that may be at work here.
Am I still running this system... yes... because it works pretty well.. as long as I don't want to dredge up too much data.
Using InfluxDB and Grafana:
This is a much newer, and very popular way to do things. The hardest part in Influx is getting the Python to talk to it (included above). InfluxDB is a "Time Series based Database" which incorporates some amazingly efficient code (good for a Pi) and has the ability to drop old data when it isn't much use anymore. Grafana is built to connect to a data source (MySQL/Influx/cloud sources/even sensor data directly) and create a dashboard of web-accessible gauges, graphs, and customise colour thresholds so you can easily see if there's a problem.
Time series databases like Influx may confuse old-school database users because there's no "create table" function. You simply add data to the database and it creates the table as needed. Influx calls the resulting "table" a "measurement". Columns can be split into two categories. Tags, which are indexed for easy searching, and Fields which just hold non-indexed values. If you're using Grafana, you'll want all of your values (temp, humidity, rainfall etc) as fields, and the only searchable "Tag" are the time/location. Note that Influx creates a time column by default to any record. It's a "time series" database after all.
Specify your sources, and do NOT use "Default" in Grafana queries if you even think you're going to add/change to another database.
For every query that you'll use to create a graph or gauge, I strongly advise you to select the database in question. As soon as I installed Grafana, I connected the MariaDB and went to work using my data to create a pretty dashboard. When I later installed and configured InfluxDB, I changed the default database because I got tired of having to switch the database over. However, that broke the entire dashboard connected to MariaDB.
Grafana queries also add a lot of features by default that may seem quite extraneous to a simple SQL query coder like myself. At first, I wondered why the "Group by: time($_interval)" was there by default, and simply removed it. That was a mistake since this function groups data into (usually averages) using the records over a few seconds, minutes, or even days/months/years. If you remove this function, the graph will just show every data point (bumps in a graph). Bear in mind the viewed time range (say last hour, day, 3 months, etc) will still work.


Things I really like about Grafana...
Grafana truly is far easier (in most cases) to use when creating graphs from data. It's a specialist graphing program that doesn't have a lot of other features that just aren't needed like Node Red does. The ability to generate graphs of differing time periods/scales using the same SQL queries is amazing. However, please note that the gauges will average out the data over the entire selected time period, so if you think of "charts = history, and gauges = current" Think again! Of course, you could change your SQL queries for the gauges to limit them strictly to the latest result (see my above SQL query in the Node Red section, or use the menu in Grafana to do the same thing) to overcome that tendency. However, I actually find it interesting for the gauges to work this way. It actually grew on me...
The performance when generating graphs, even with large datasets is substantially better using Grafana than the Node Red dashboard. There's very little lag, even using MariaDB. However, Influx has the edge in terms of performance and data visualisation.
Grafana gets even more efficient using Influx, which of course has better long term data management. However, the main reason I like Grafana is the intuitive way to create multiple line/series graphs. Simply create a query for each line/series and you're set!
Things I don't like about Grafana...
There's only a few niggling things, firstly, that there is no "Compass" style gauge like Node Red does. For wind direction, I haven't found a good option. Grafana has a plugin called "Wind Rose" which I've personally found to be difficult to configure, and suffers from several bugs.
The default query is a little interesting to adjust. You'll see the query as a series of boxes in rows, and some rows have + symbols. Where you click inside each box matters. For instance, the select section will usually be followed by a box that says "field( )". Clicking inside the parentheses will provide a drop down list of the fields in your database measurement/table. Note: Tags are not included as an option if you're using InfluxDB. Clicking anywhere else will merely offer you a drop down list of "remove". This took me a little time to get used to. Also, every query will have a Group by: "time($_interval)" bit that seems to cause problems if you don't get it exactly right, as you need to have some form of aggregation (Mean, Max, Min, Mode, etc) in the select statement in order to use the group by function. More often than not, I'll remove the group-by function entirely if I want sheer raw data, and watch as my graph/gauge starts to work again.
Things I've learned along the way:
- Make time to do, and complete a project like this. It's ok to do the soldering one day, and coding the next. But if you go months between "sessions", you'll have a hard time remembering what you're up to, or even how you did something previously.
- Cats like sleeping on electronics, playing and occasionally ripping out sensors when they get caught in the cords.
- There's always more than one way to do something. However, instructions of all stripes may not work for your particular situation, and may be out of date. It's not unusual for there to be a better way to do things. So do your research.
- Newer Raspberry Pies have better handling for sudden power outages than older models.... which leads me to...
- BACKUP YOUR SCRIPTS/DATA/SYSTEM IMAGES!
- Some rudimentary parts like Pi "Prototyping Hats" may not be clearly labelled. Take the time to test each connection with a multimeter to figure out where everything needs to be connected.
Finishing up....
I just need to tend to the basic hardware now.
- Design and 3D print a case to protect the Raspberry Pi itself, since mine will be inside, waterproofing isn't necessary. However, since I have a soldered hat with my circuitry on it, a standard Pi case won't work.
- Design and 3D print a sensor shield for my BME680 sensor (temp, pressure, humidity sensor)... replace cat-mangled sensor with new one.
- Attach new sensor shield to existing sensor array, run the wiring and check it.
- Attach all sensors to their final site, connect the wiring to the Raspberry Pi indoors.
- Boot the thing up and see how it goes.
February 2021 update..
I've designed and printed the case for the Pi. If you're interested, please see my "Thingy" (uploaded to Thingiverse) found at:
https://www.thingiverse.com/thing:4776051
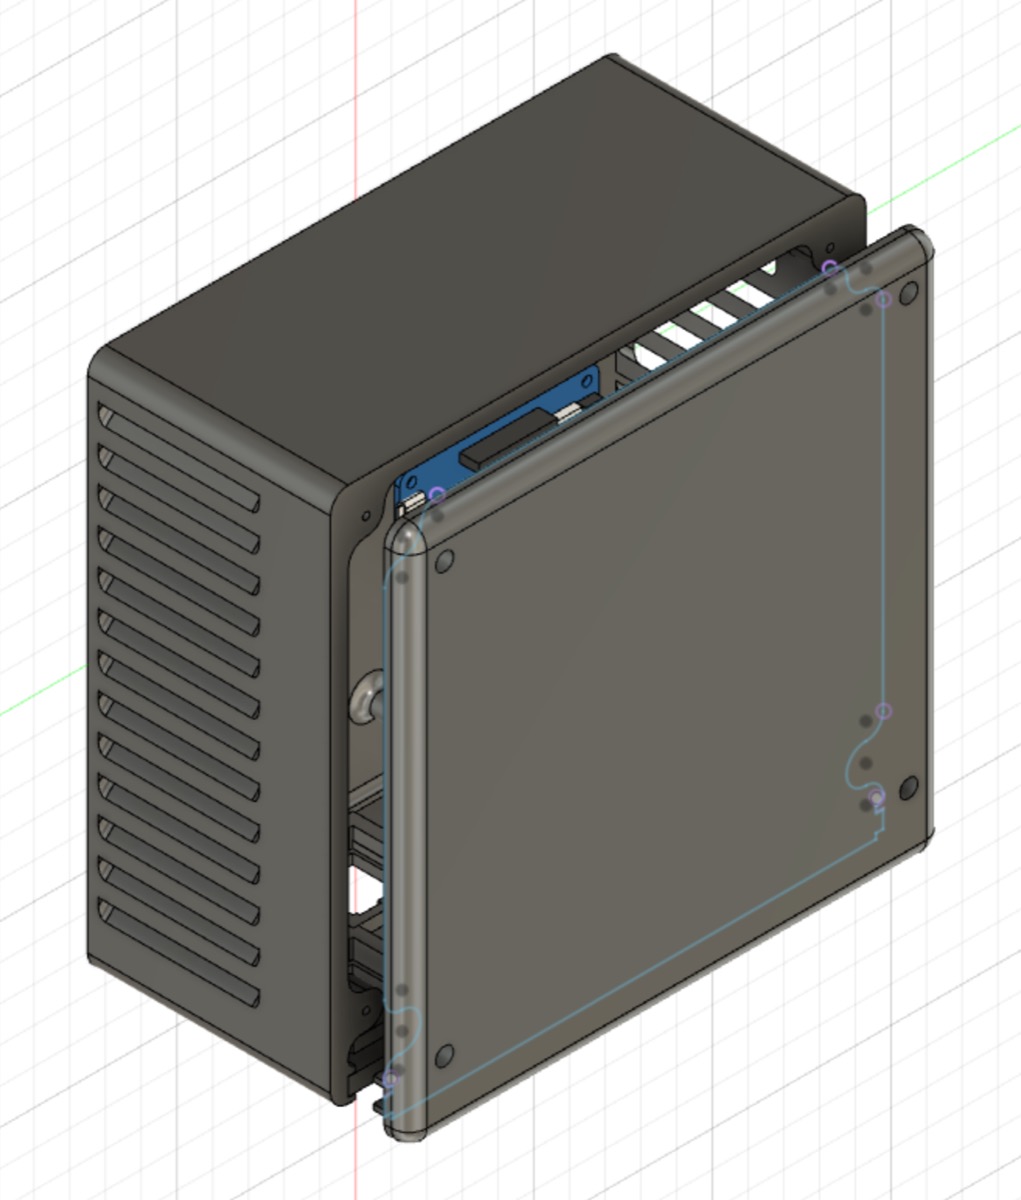


And to show how the sockets look after carefully placing and shaping them.. mounting the extension cords for the power and HDMI ports, connecting the Krone-styled RJ12 and RJ45 ports, and checking all the Pi sockets line up with the holes in the plate.

I still need to finish the sensor shield, install the sensor, mount the sensor array to my intended spot, and of course, mount this box to the right spot in the garage. Then all that remains is cabling it all up. If all goes well, it should be running by next week.
I'll attach images of those steps (and I've uploaded my designs to Thingiverse, should you want to print your own version) when I do those. But for now, I have other things to do..... <cue groan here>
March 2021 Update:
I was somewhat "on the way" to designing my own sensor shield, but then I found this on Thingiverse:
https://www.thingiverse.com/thing:1067700
I downed my partially completed Fusion360 models, and skipped straight to slicing and printing. I spent the better part of a week printing the parts out of PETG, and then sprayed the parts with UV resistant white paint. The project was clearly designed by an imperial-loving American, so I used some imperial thread, wing nuts and u-bolt that I bought from my local Bunnings. I was honestly surprised that they were sold in such a convenient location.

So I mounted the shield onto the existing weather station kit (anemometer, wind vane, rain guage) etc. Installed the temperature, humidity, and pressure sensor (the BME680) into the shield.... and got ready to mount the sensor array onto the garage....
... and found that I needed to build a mount that would enable the array to be mounted around the guttering on the roof. Sigh.
I managed to scrounge a scrap piece of kitchen bench from my other projects. Painted it in several layers of UV resistant white paint, bored the mounting holes into the wood, and strapped the entire sensor array to the garage.
Remember: Take note of which way your wind vane base is pointing. Otherwise your bearings will be wrong. There are little N, E, S, W markings on mine. However, other kits just have a little N marking the north point. Use a compass (or the compass app on your phone in a pinch) to ensure correct alignment. Also, because the wind vane is weighted on mine, I needed to ensure the vertical mounting post is actually vertical. A lop-sided mount will favour a particular direction in weak (or no) wind and skew readings.
So what does it look like?
I know I took a photo of it somewhere, but I have since lost it. I'll take another when it isn't raining outside. Stay tuned. I did call this "how NOT to build a weather station", right?

So all that was left was wall-mounting the Pi box inside the garage where:
- There was power.
- The cables to the sensor would reach
- It would be accessible enough to repair should I need to.
- Unlikely to be damaged, showered in saw dust, grinder shards, or subjected to other dangers.. like collisions with my bandsaw/drill press trolley as I stow them against the wall.
In my case, I had a choice: Power and ease of access, or sacrificing those for close proximity to sensors. So I chose the former. Which meant....
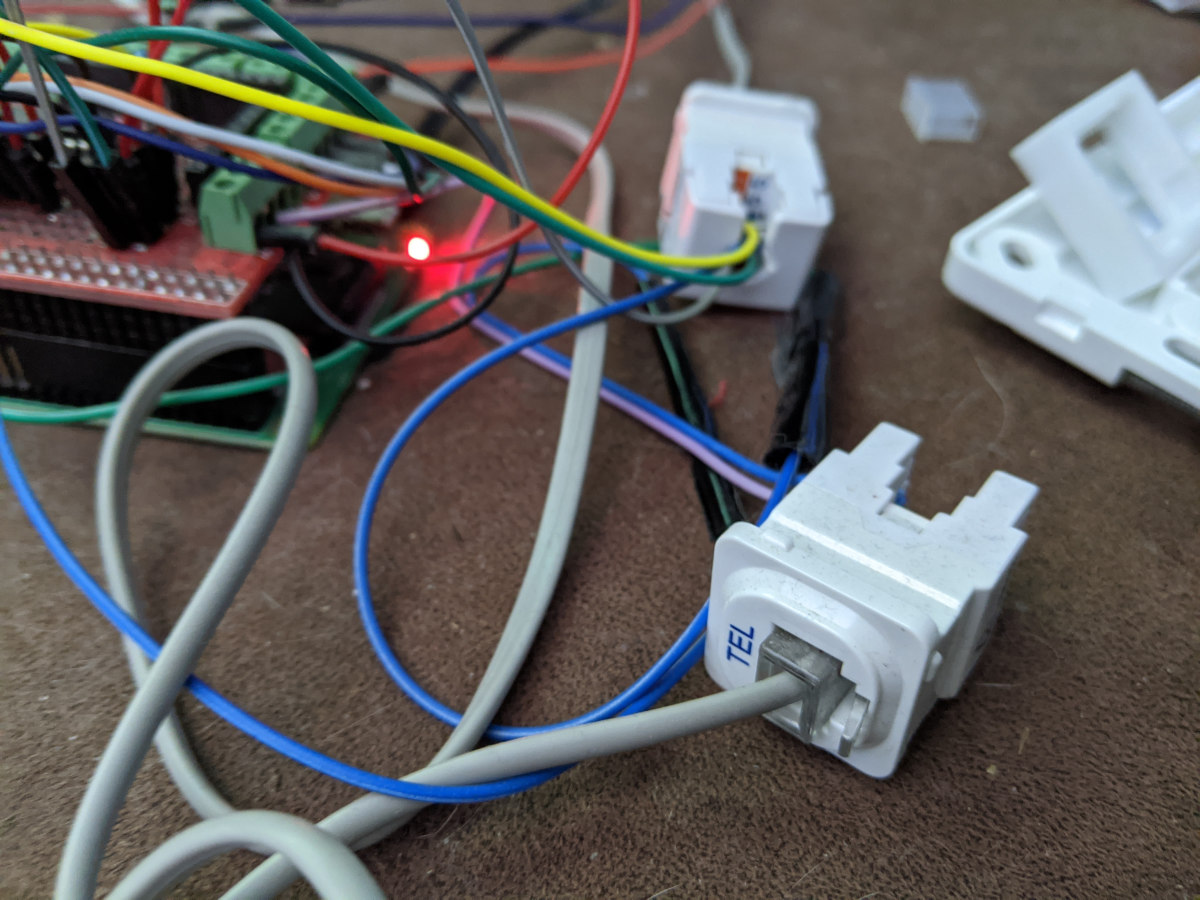
I needed an extension cord for the telephone cables. My Cat 6 cable was more than long enough.. but the after poking the telephone cables under the roof tiles, and along the rafters, I was 1 metre short.
Unfortunately, the local hardware store did not sell "RJ12 extension cords" so I needed a "joiner" (female to female) connector and two of the shortest RJ12 (telephone) cable I could find. Which was inconveniently, 5 metres each. Which I grabbed and installed.
Initial in-situ power up and location-based networking woes:
I turned it on, and the little lights on the Pi fired up as I expected. Great!
I tried to connect to it... nothing.
Then I realised.... I am running multiple Wi-Fi access points. The front half of the property runs off one (where I did all my prototyping and testing)... and now that the weather station (and Pi) is in the back, I needed to reconfigure the Pi to connect to the other access point.
If you've forgotten how to do that, I recommend the raspi-config command... assuming you have root access to your Pi. With network access failing, you can't simply remote into it using SSH. So I had to plug a keyboard and screen in.
So I did that (yay for easier access for screen/keyboard ports to the Pi) and after a minute of wi-fi configuration and rebooting. I could connect to it... remotely.
While I'm here....
I also strongly recommend you set an assigned/static IP address to the weather station so you aren't playing the game called "Which IP address did my router give my Raspberry Pi?" and that's a game that's exactly as fun as it sounds. You can do that in your router, or on the Pi itself. Sometimes I set both, just to be doubly sure.

June 2021 Update:
I was chatting with a friend the other day, and when I told him that the weather station was up and running, his first question was:
"So it is shared on your web site?"
Well it wasn't at the time, and it's not for the lack of trying. I've had a few tentative attempts, but the sad fact is that I haven't found a way to safely share it with the general public. All access involves some risk, the turn key options of Grafana (like snap shots) do not update with future information nicely, and the fact that I am running this thing on a Raspberry Pi means that if multiple people browse it all at once, the system may crash with the extra workload.
Some of my experimental (and code adapted) plugins had some trouble with many of the "turn key" options, so I had to get a little creative and merge several disparate systems in a "let's all play nicely, children!" plaintive plea. It's entirely possible that any updates or service interruption to any part will kill the whole system. That's not a system I'd like to share with the general public.
So for these reasons, I've decided not to open it up to the public. Unless I can upload the captured data to an open source weather service.. I'll look into that.
Another forehead slapping moment...
Ok, so I've built this thing, and had it running in various prototyping stages for almost a year. The data may not mean much (since it was inside until March) and also, I've tweaked the program several times to adjust for minor differences in sensor readings. Temperature is fine, rainfall is fine, humidity is fine.. but you know what I got horribly, horribly wrong? Air pressure.
Air pressure, not as conversational as rainfall, temperature, or even wind for that matter... got forgotten about. I connected the sensor, wrote my data harvesting program so it got the raw data, wrote it to the database and moved on to pretty things like graphing my data, and making 3D printed boxes.
So what was wrong with pressure?
I was checking my readings against several weather stations, and finding that my pressure levels weren't just wildly different from coastal weather stations as expected, but different from weather stations in my area. How different? Well how does 71 hPa/mbar too low sound.... if there's a pressure difference that high from my place to the nearest weather station (maybe a few kilometres)... For the meteorological mavens out there, that's the difference between a calm sunny day at the beach, and a category 5 hurricane.. so just a bit off.
I wrote to an Atmospheric Scientist named Dr. Robert Fovell from the University of California, L.A campus (UCLA) whose digital course I had purchased and recently finished. Given that air pressure drops as you gain altitude, it didn't make sense that weather stations both at my elevation of 627m, and at sea level were reading very similar results. So I asked him about it.
He kindly informed me that weather stations were indexed to sea level, so the readings reflected differences in weather, rather than the effect of elevation between one location and the next. I didn't know that. He also told me a handy formula on how to (roughly) compensate for altitude.
He stated: "Pressure will drop roughly 120 hPa/mbar per kilometer of altitude". If 1000 hPa is the usual average reading at sea level, it's not hard to calculate the difference.
So since I'm 627m up, (627m/1000m) x 120 hPa = pressure difference due to altitude.
That's 0.627 x 120 hPa = 75.24 hPa. My readings by this formula should be 75 or so lower than sea level if I leave it uncalibrated. Adding that difference of 75 to my existing readings, and voila, you have a correct-ish reading.
So I created a little variable in my Python scripts called "altitude_pressure_offset", assigned it to 71 (because that was actually closer to the other weather stations in my area). Then I simply appended the line of code that got pressure readings from the sensor to add the variable value to any result.
At the end of the day my problem, was that I completely forgot to account for altitude. Since this is my first weather station, I've never had to consider other stations. So ideas like indexing it to sea level for easy comparisons between the readings of two (or more) weather stations was completely outside of my awareness. Thanks once again to Rob for the help.
So is it finally over?
I guess we'll see. I've noted some really strange behaviour between Influx DB and Grafana which sometimes fails to represent the data accurately. However, since I'm using both MariaDB and Influx, I just switch the source of certain gauges/charts over to MariaDB until I get a believable (and hopefully accurate) result. I'm sure I'll be tweaking this system, trying to understand what's going on with Influx for a while. It is probably 99% of where I'd like it to be.
When the system displays some questionable results, I needed a reference to check my data. So a quick Google search later, I found that another person has setup a similar weather station just a few blocks away, and has been sharing their data for years. <insert image of me doing a self-targeting forehead slap here>.
Gotta laugh, right?.. even if it's slightly hysterical/manic.
Associated projects, and experiences learned:
I'm truly amazed at what a $100 computer the size of a credit card, running an SD card as a hard disk can do. Now that I have the code (and some spare sensors) I intend to build a similar setup for my cheese cave, and internal house temperatures (for comparison with the weather station).
Dedicated display devices:
I have another Raspberry Pi that I've connected a 7" touch screen to. My original intention with that was to use it as display for the weather station, but I've found that it's a bit small to read from across the room. The touch gestures are a little cumbersome, and there's no nice way to fit a lot of information on a screen that small for "up close" viewing. I've also found the light leaking from the panel makes it too bright at night time for sleeping, and dimming the screen makes it hard to read. If I were to go down a cost-effective route, I've found that repurposing my ancient iPad or old laptop for this is a good choice, but If you want what I'd consider the "best" experience. I'd strongly consider using a 10" or larger e-ink (probably monochrome) display if I could stretch my budget that far on a spare Pi for a clean, easy to read display.
However, simply accessing the Graphana/Node Red pages from my phone, tablet, PC, laptop, and even smart TV has worked so well, I don't really feel the need to build a dedicated device at this stage.
Database size...
One of the things I expressed concerns for in the building process, was that the database, over time would exceed the Pi processing power. I've left the MariaDB collecting readings every 5 minutes, and after roughly 6 months, and nearly 53000 rows, the database takes up a grand total of 12MB. My SD card is 32GB, and has 25GB free. So assuming I decide to keep 10GB for "swap space" (which is insane) I have enough space to record 625 YEARS of data. With InfluxDB running along side, I can expect a solid century at the very least.
Of course, I don't expect the Pi to last that long, certainly not the SD card. I'd probably expect a few years from the Pi, and maybe a year or two from the SD card if I'm lucky.
Computational performance is most important when the graphs are being rendered, not when the data is being recorded. Grafana is much more efficient than Node Red. As a month of data being plotted with numerous SQL queries takes over 20 seconds to render. Grafana does all the plots with simplified, often single queries, and so far takes under a second to render all the graphs, even trailing back through the latest 6 months of data.
Naturally, I expect the data to get harder to manage as it becomes more plentiful.
Database management and data backup is key:
Regular backups and "clearing off" data from the Pi will help immensely. I'm likely to do a mysql dump of the data to one of my more powerful systems every year or so to maintain a smooth running system. I can plot the data much more easily from there.
Conclusion:
I hope I haven't scared you off. I've learned a lot, used systems and software I've never tried before. I appreciate both the software and hardware expertise it requires to make a working product like this. Even designing and 3D printing my case taught me a lot. So the next time you're looking at a device like this "on the shelf", maybe you too will appreciate the effort it takes, the considerations and prototyping it requires to get a reliable product. I have a lot of respect for industrial designers, electrical & software engineers, and of course, those with the vision to coordinate all of that.
One of the best things about this, is that I can change anything. Don't like the way something is done, code it! Think a weather site who's nearest station is 20Km away at a different altitude isn't accurate enough for your situation? Add yours to their system. Want to rearrange and easily view your data in pretty graph forms? Pick a way to do that. Doing things for yourself teaches you so much. While the process is frustrating, time consuming, and always has the possibility of failure, the rewards are commensurately great. That said, I can't say that I've saved money on this one. But if I made another, I can use what I've learned, and adapt it to my needs.
So what's next?
I'm thinking a cheese cave "weather" station next. Strip it down to temperature, humidity, and maybe air quality. (I don't need wind and rain), perhaps have a couple of sensors to monitor multiple "zones" in the fridge to see how consistent the temperature really is from top to bottom. It will be especially handy when monitoring the affinage (aging) process, which gets more important the longer cheese ages.
Wow am I getting nerdy!
Stay safe and have fun!
Ham.